PsySH manual
💾 Installation
🖥 Usage
- ⌨️ Command line options
- ✨ Magic variables
- ⏳ Managing history
- 🔄 Code reloading
- 💲 System shell integration
- 🎥 Tutorials & guides
- 🐛 Troubleshooting
The easy way
The other easy way
die()ing all the time
PsySH can be used as an interactive debugger, much like JavaScript's debugger statement, saving you
from endless var_dump() and die() iterations. Just drop this line in where you'd like to
have a breakpoint:
eval(\Psy\sh());
![Auto<code>[tab][tab]</code>Complete](/assets/img/autocomplete.png)
[tab][tab]Complete
PsySH has tab completion for variable names, functions, classes, methods, properties, and even files!
Just start typing, then hit [tab]. But you probably already guessed that.
(Tab completion requires Readline- or Libedit-enabled PHP. But you really should have that anyway)
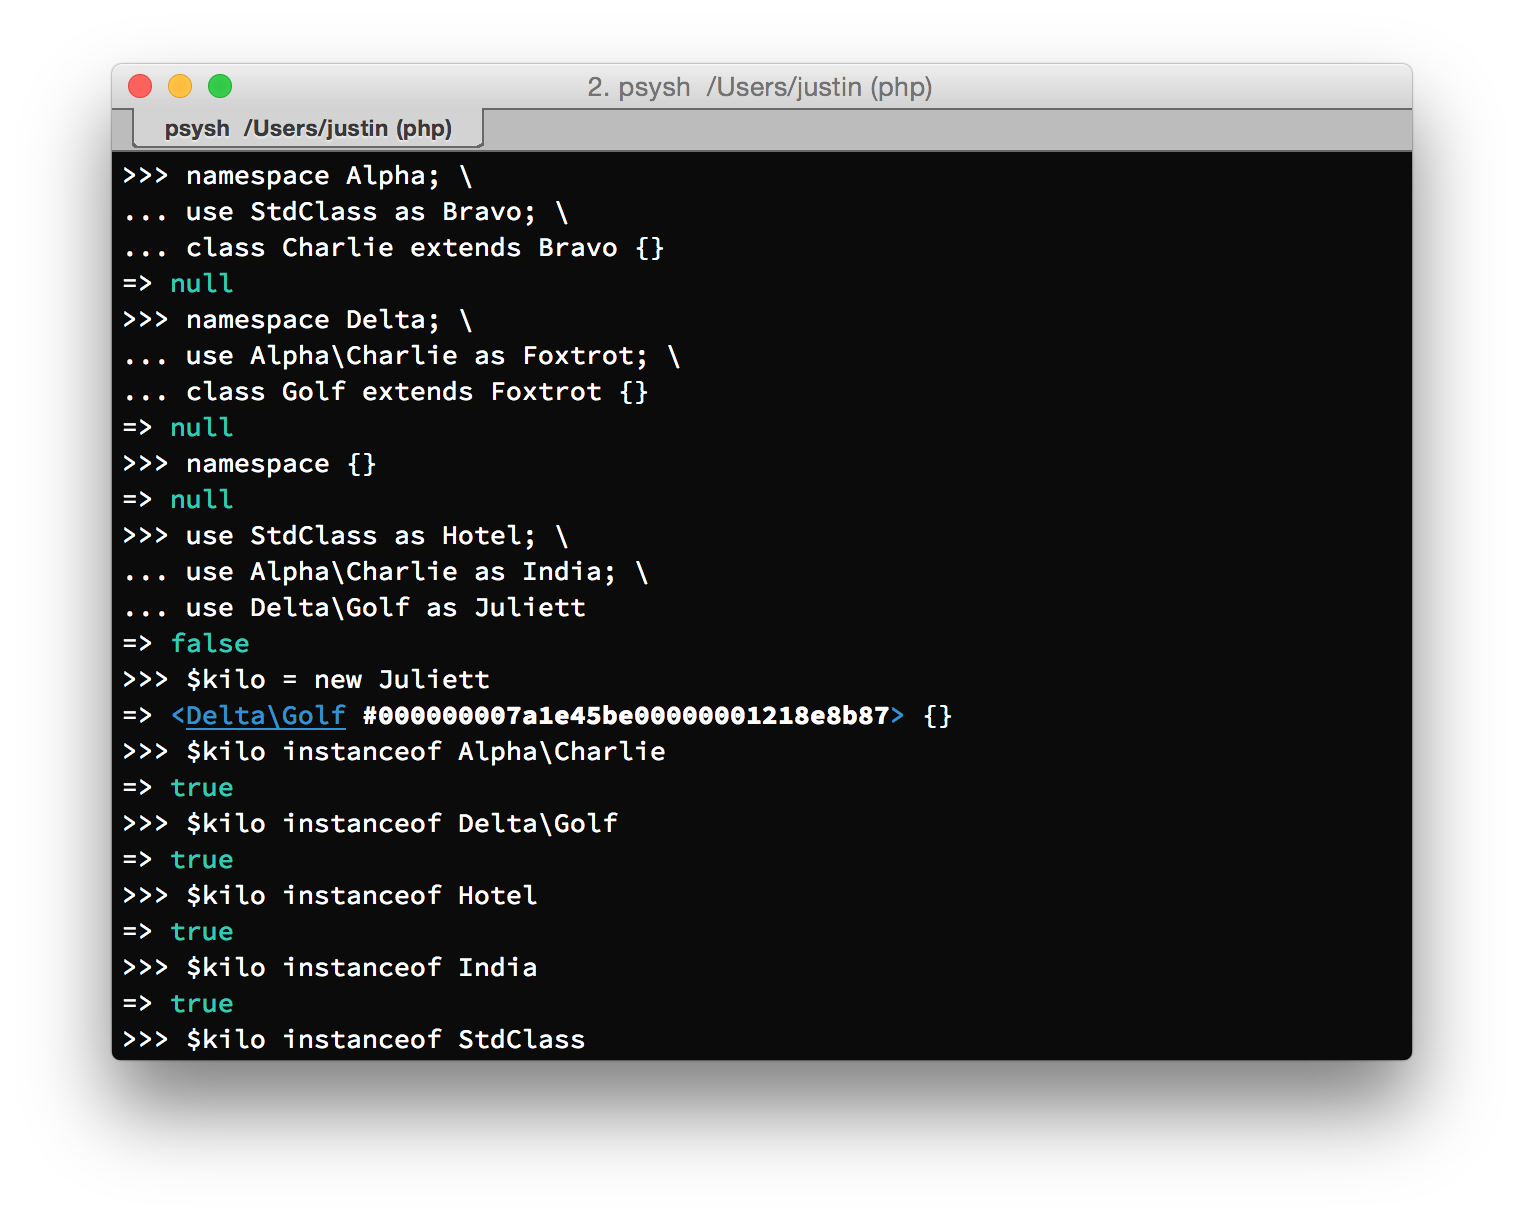
Most PHP shells are terrible at namespaces. PsySH does just what you'd expect.
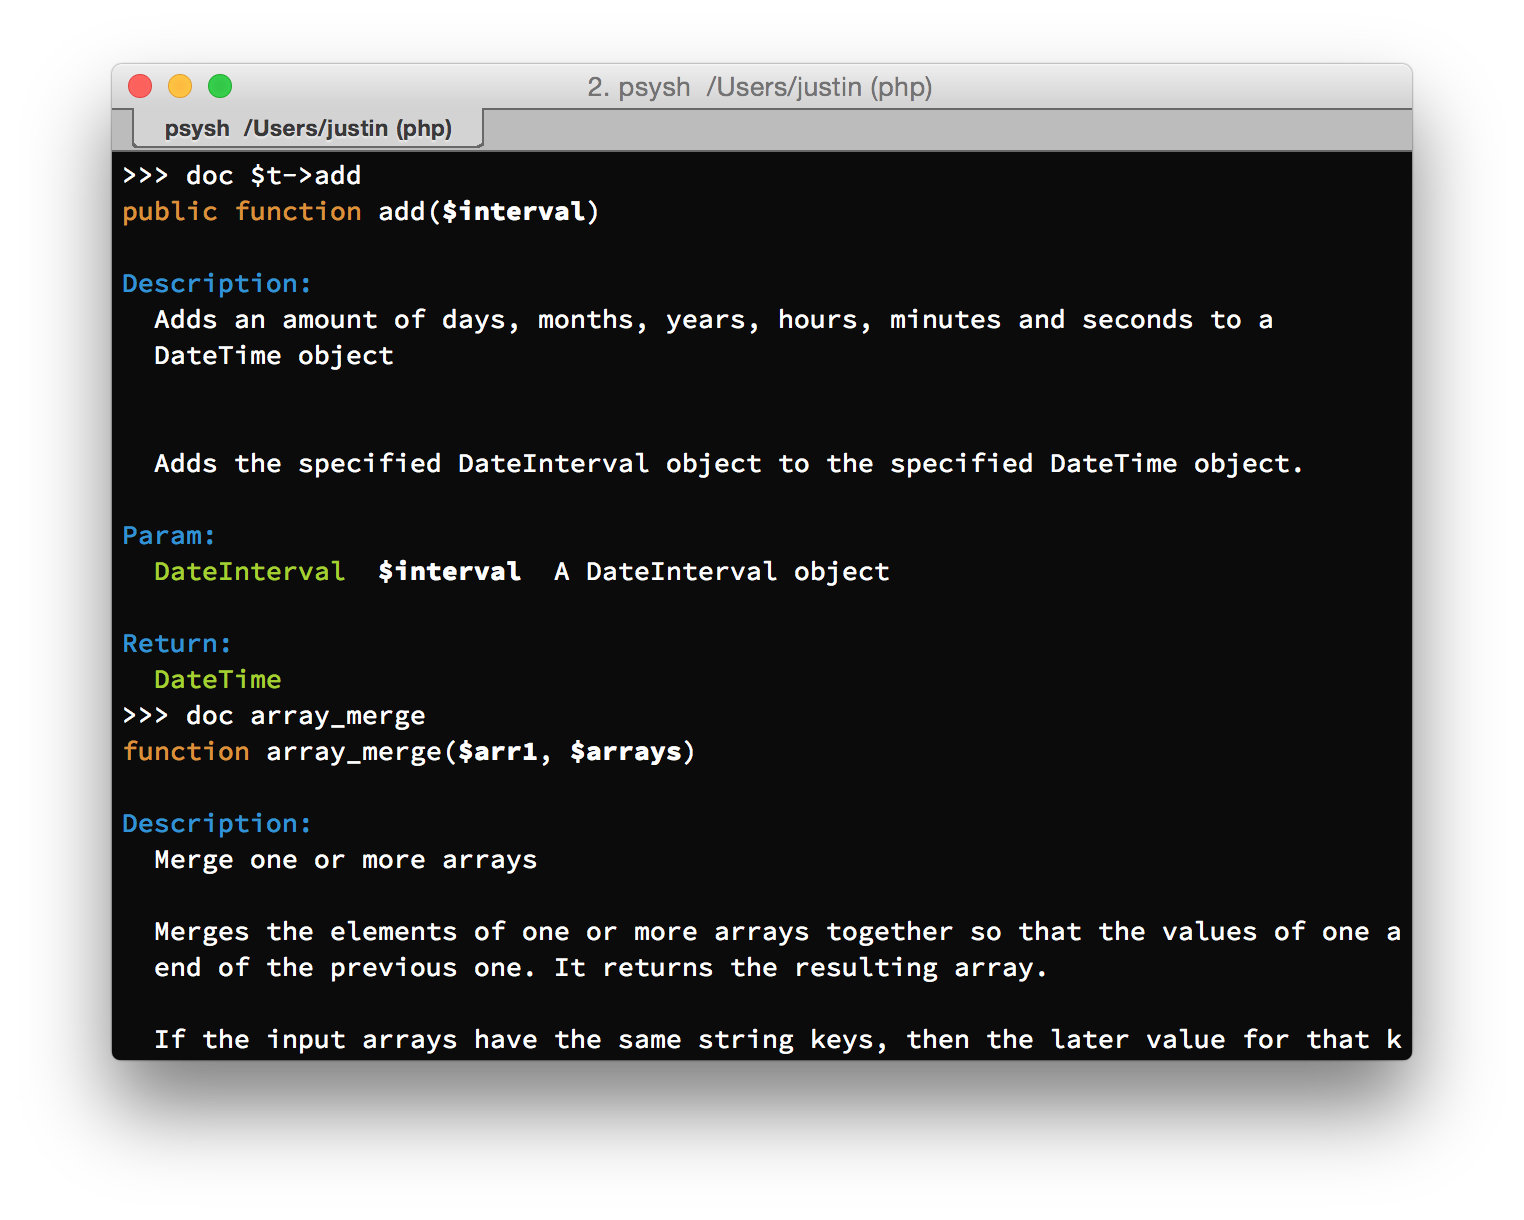
Have a question about a core PHP function? Try doc array_map.
Want to read the documentation for an object property? Run doc $response->statusTexts.
>>> help doc
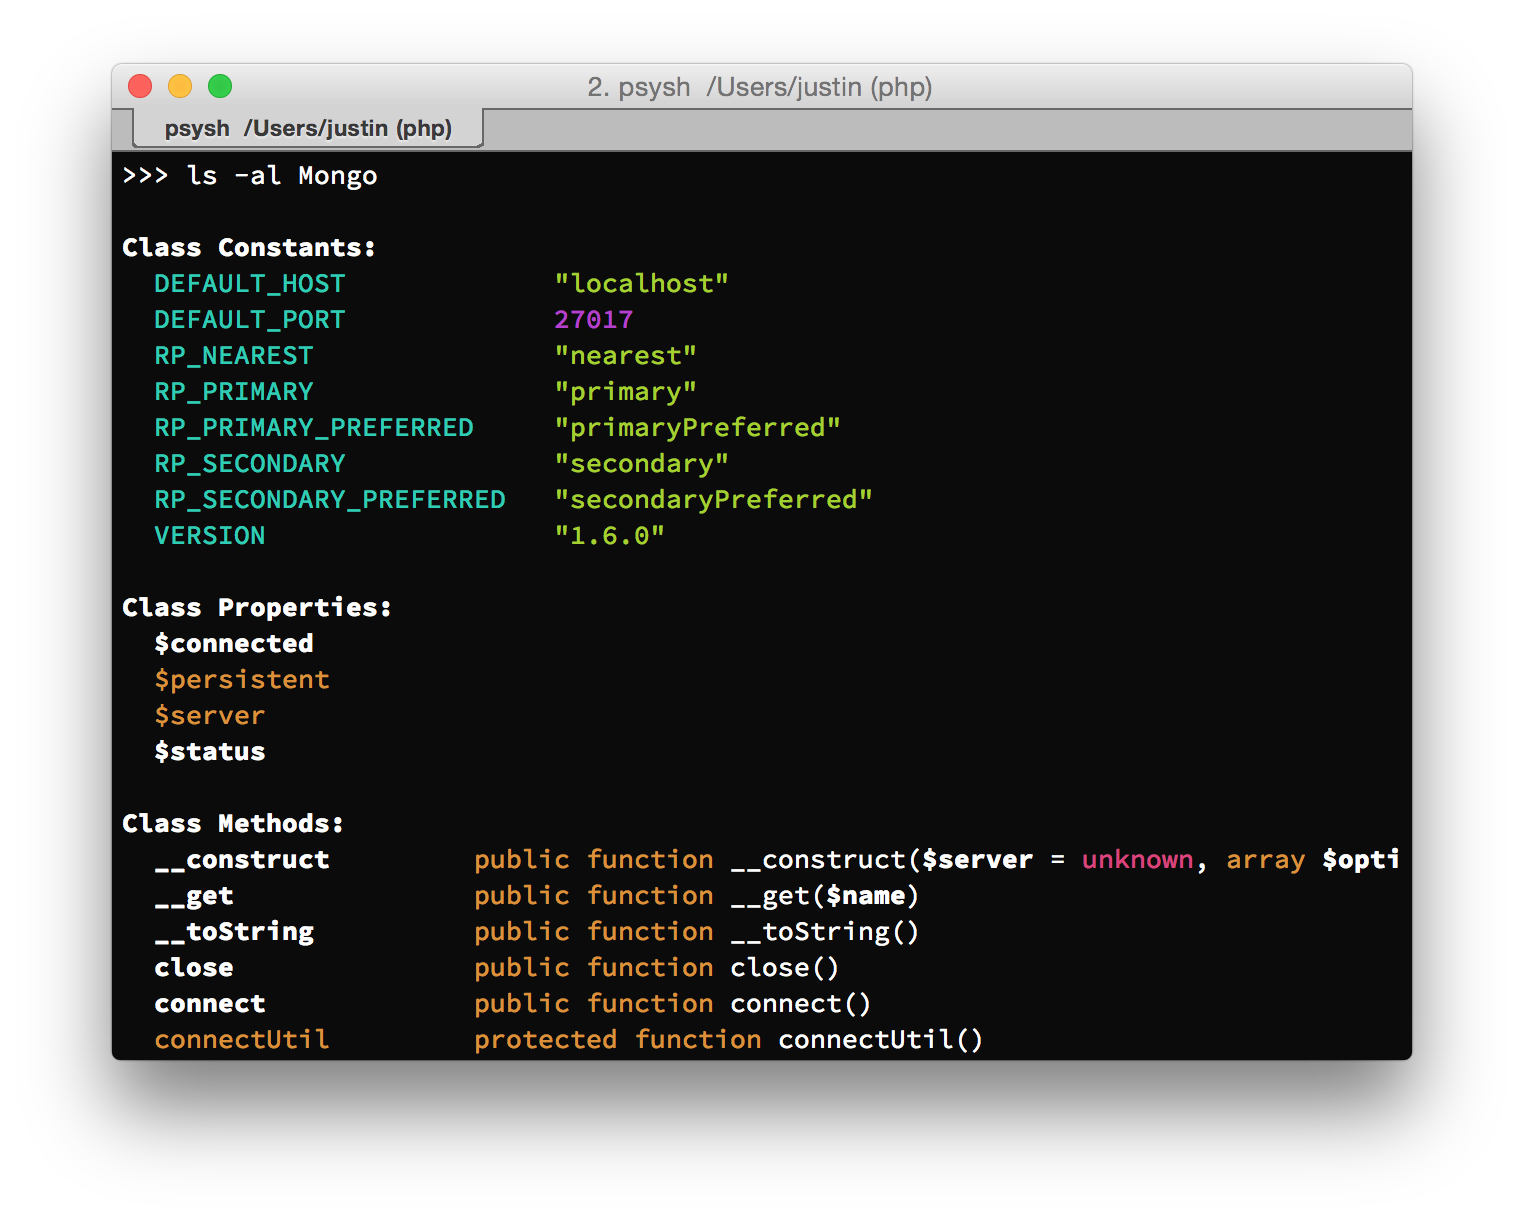
The ls command knows all about your code — and everyone else's. Easily list and search
all variables, constants, classes, interfaces, traits, functions, methods and properties.
>>> help ls
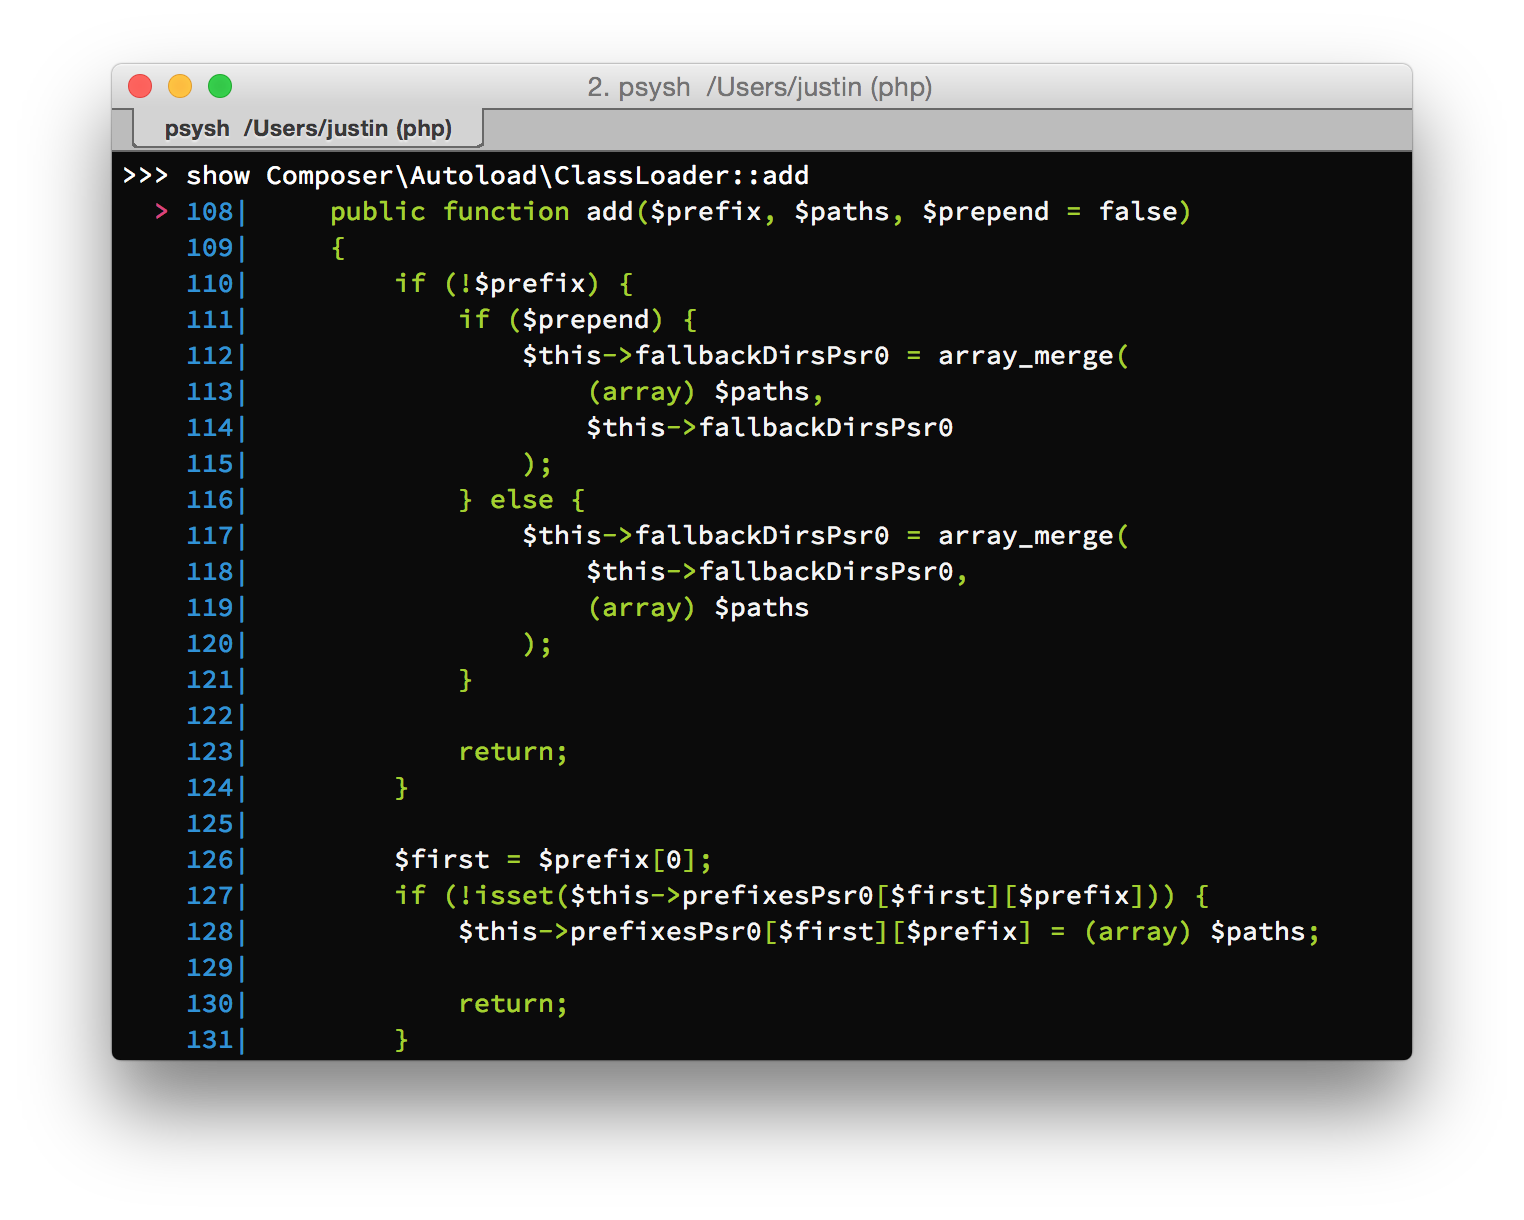
Easily show the source code for any userland object, class, interface, trait, constant, method or property.
>>> help show
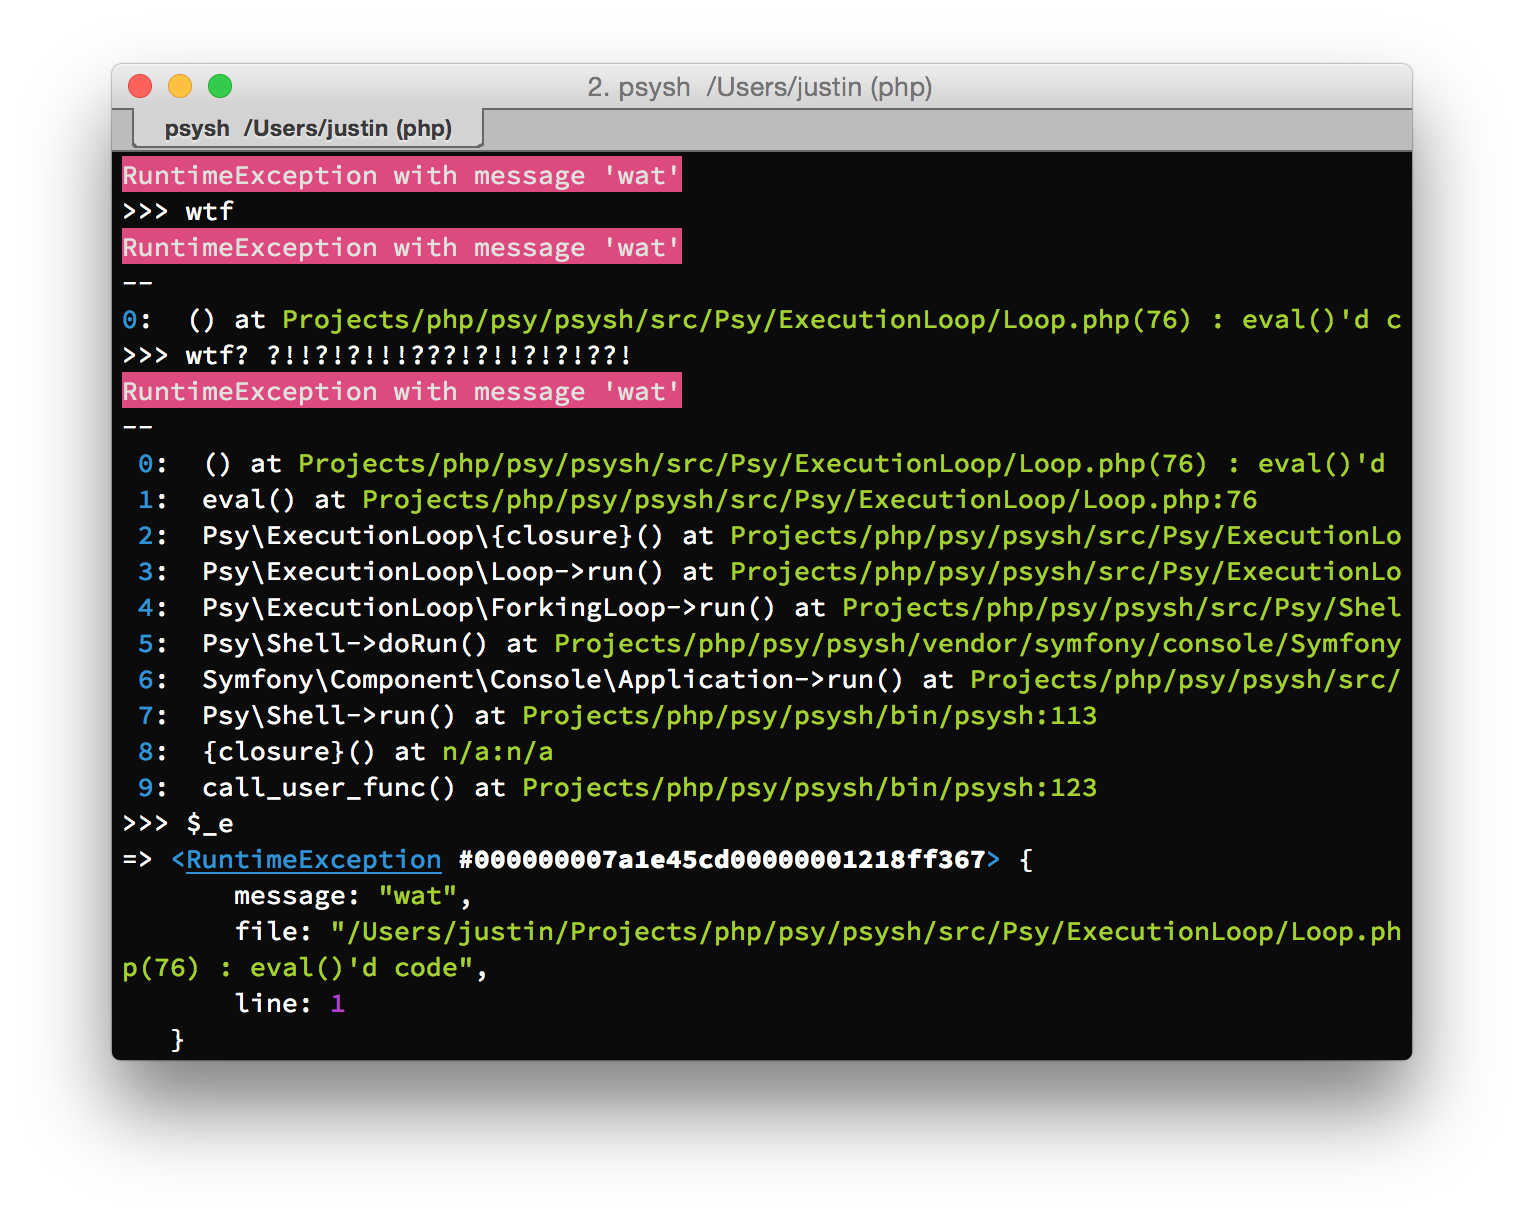
No worries, PsySH has your back. We caught it for you, and made it available via the wtf command.
>>> help wtf
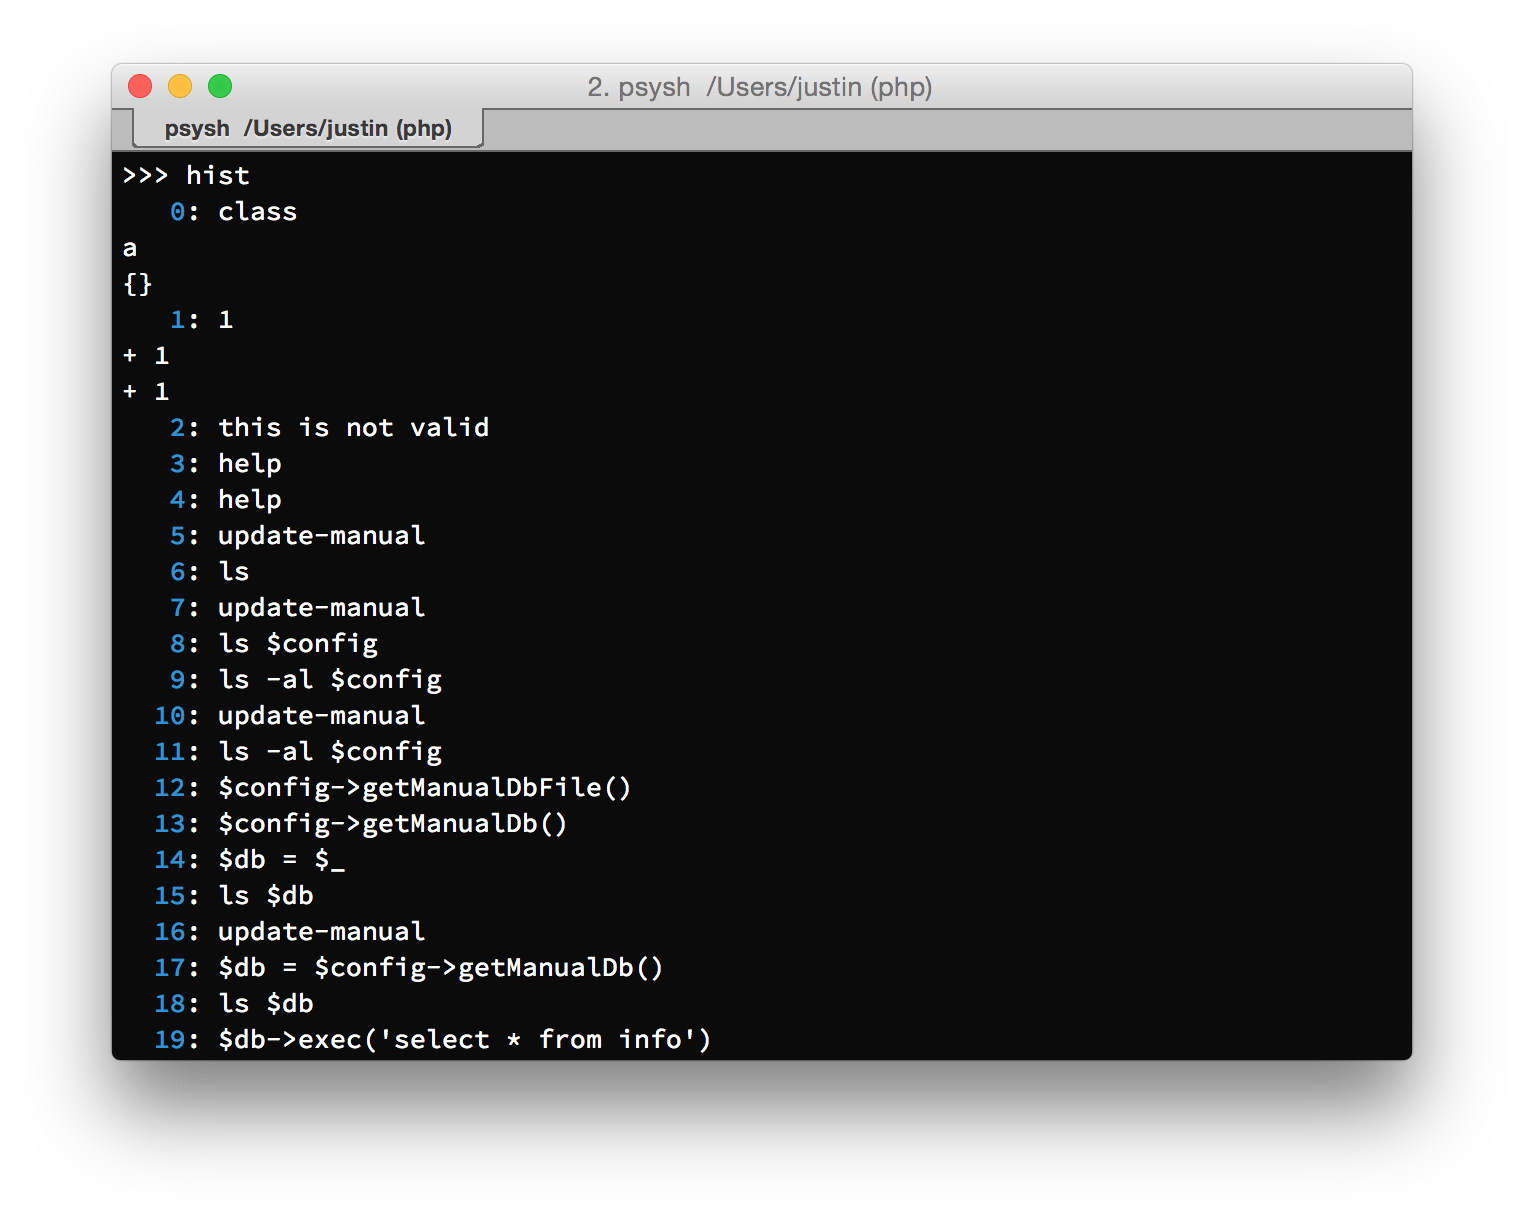
Show, search, save and replay your shell history.
>>> help history
If the awesome features listed above aren't enough for you, you can write your own commands! PsySH has first-class
support for custom commands — just register them in your ~/.config/psysh/config.php.
$shell_ive_used_since_2008?Check out the slides from Interactive Debugging in PHP at OSCON 2013 for an overview of the state of PHP debugging and why PsySH might be for you.